

Reports and studies are a lot to digest, so we’ll pull out some key takeaways which may help your brand assess how it is performing compared to others. The study we’ll be referencing is the 2022 Instagram Stories Benchmark Report by RivalIQ.
Post Engagement by Media Type
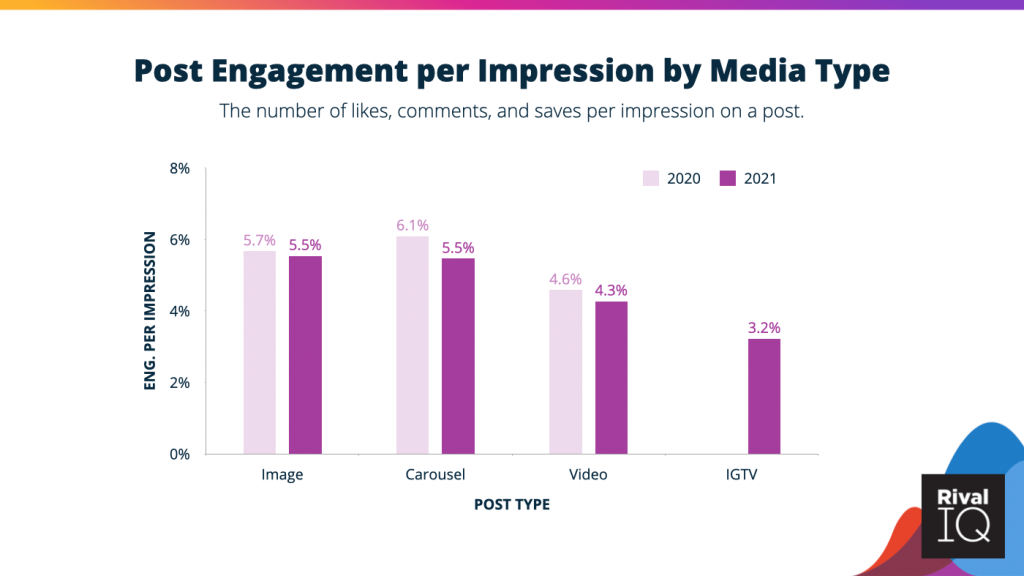
Instagram is working hard to incentivize more video content to compete with YouTube and TikTok, so this is a good area to invest in in 2022 to engage both followers and the algorithm.
Story Publishing Frequency:
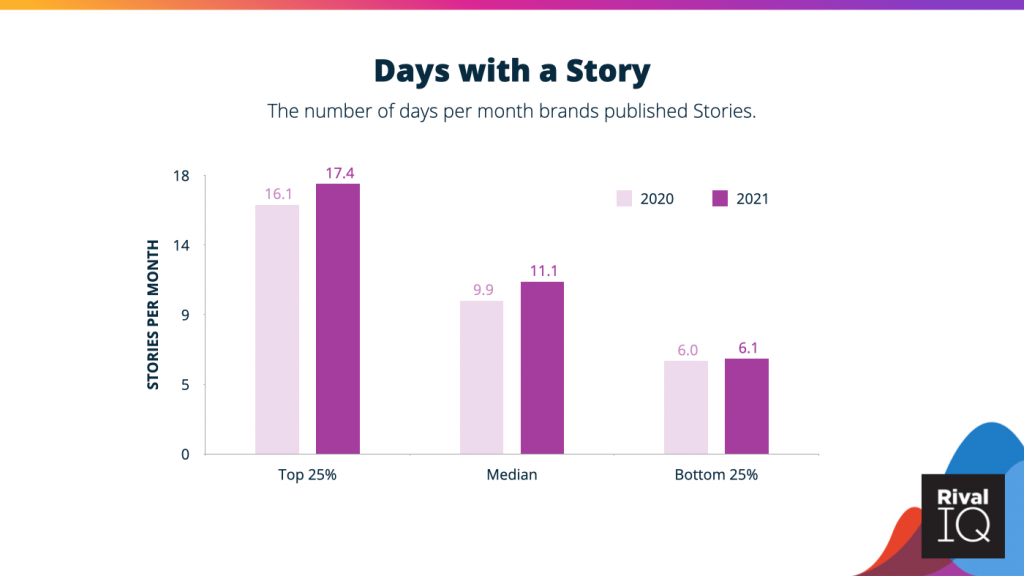
Frames Per Day
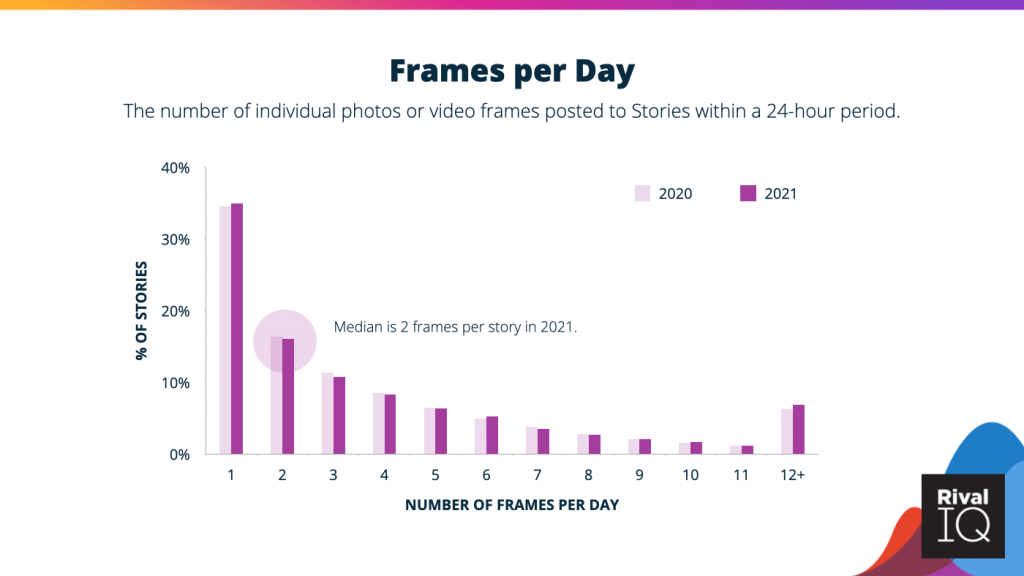
Want to dive deeper? Read What’s the Story with Instagram Stories. Or, contact us and start the conversation about how we can help you reach your goals for with Instagram content.